TED Talks through DATA -
TED Talks through DATA -
Dataset & Approach
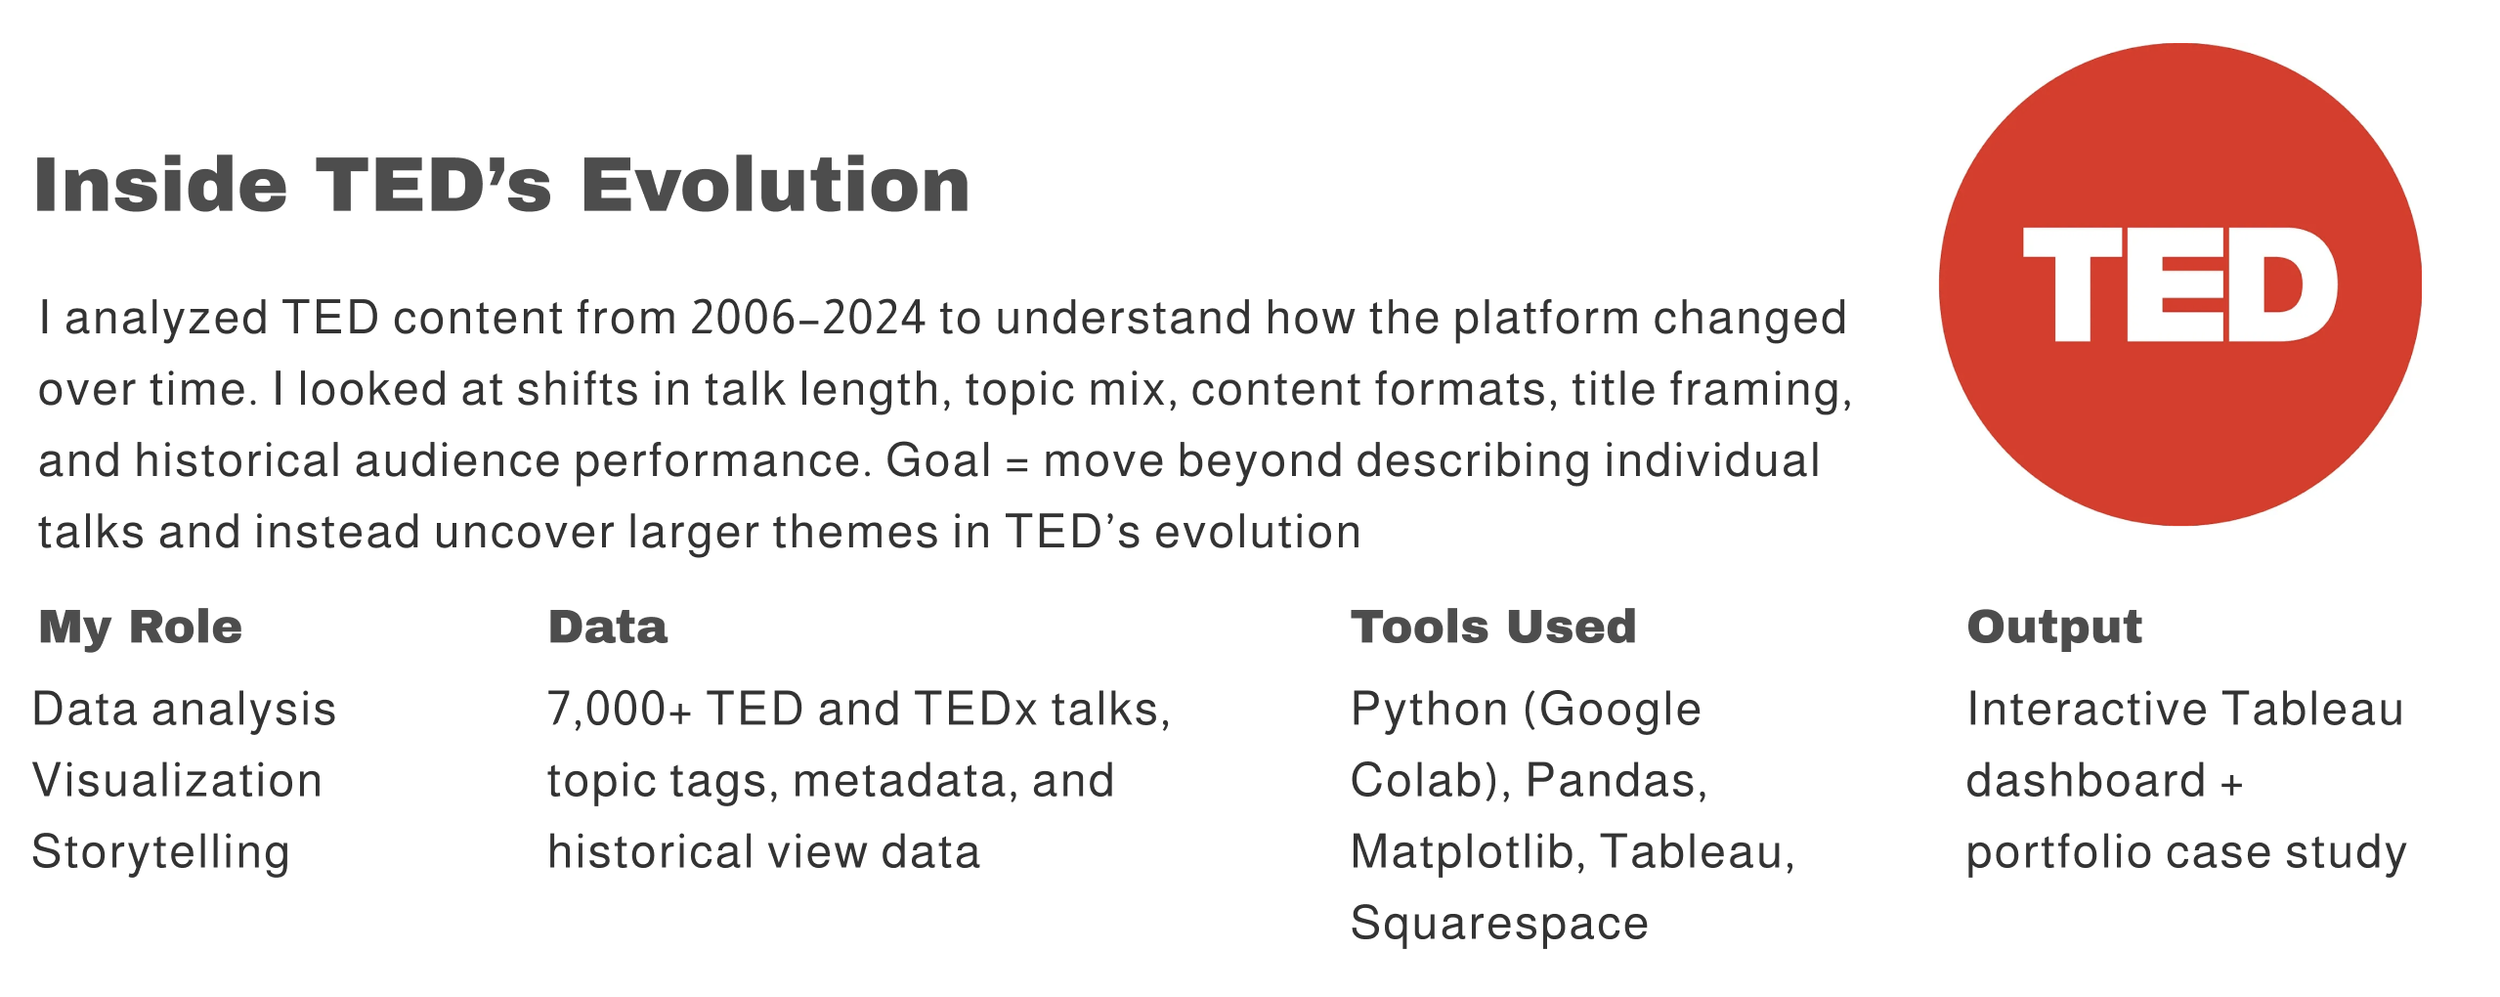
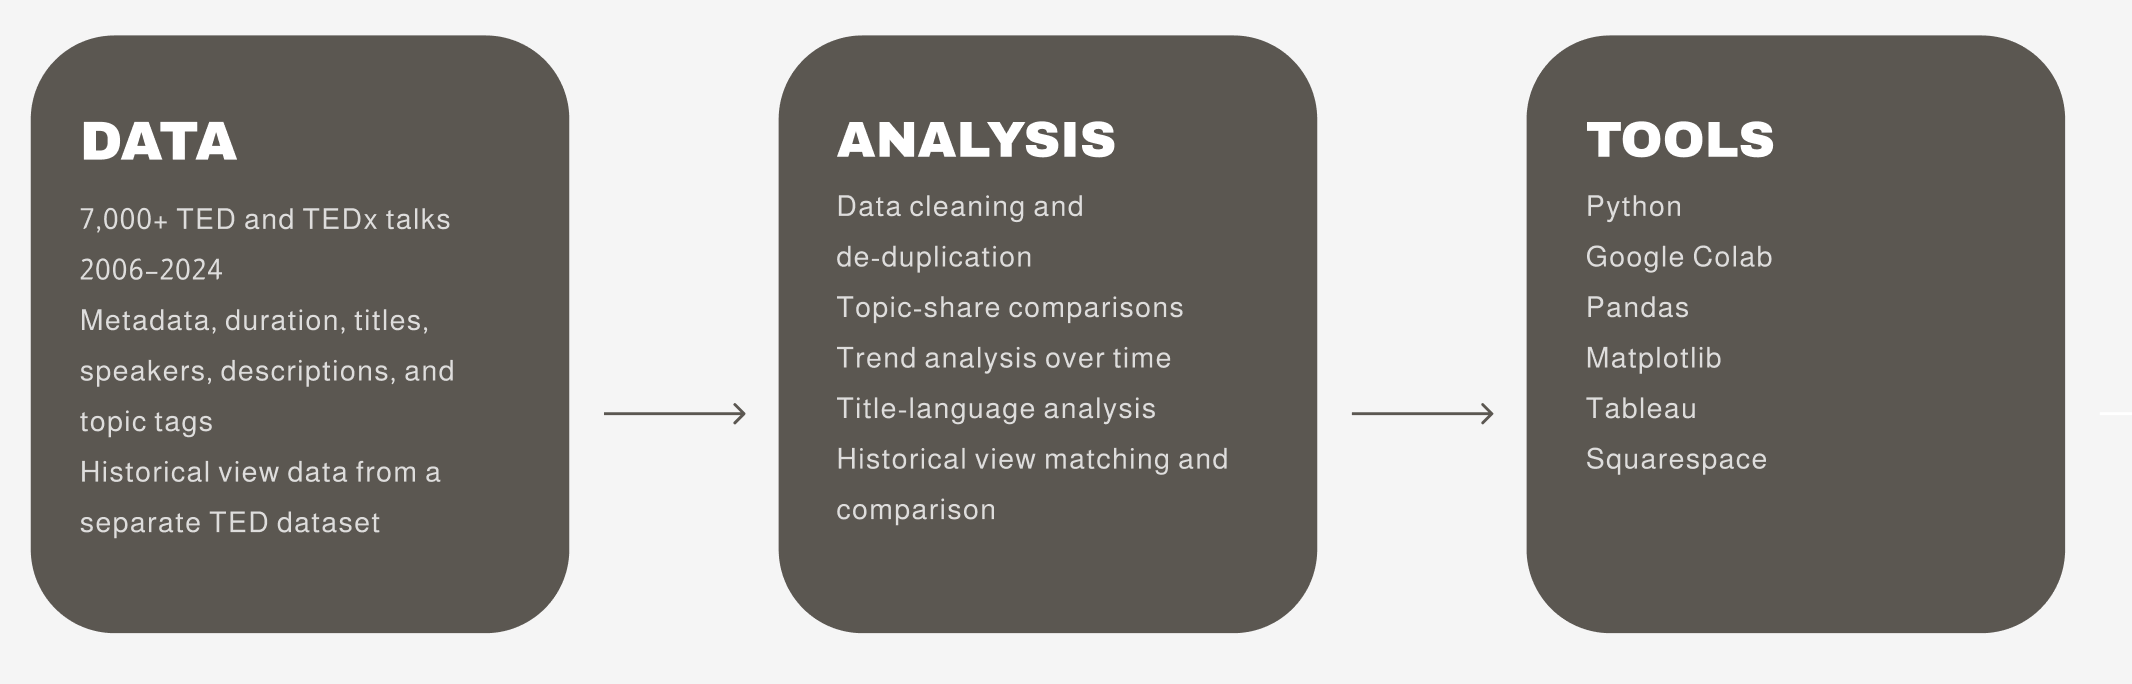
I worked with a TED/TEDx dataset covering more than 7,000 talks published between 2006 and 2024. The dataset included talk metadata, titles, descriptions, durations, speakers, and topic tags. To add an audience-performance lens, I also matched the newer dataset with a separate historical TED dataset containing view counts. I used Python in Google Colab to clean, merge, and explore the data, then built the final interactive story in Tableau.
A note on the data:
The historical view dataset only covers talks through roughly 2020, so those numbers are used as a historical benchmark rather than current view totals. The two datasets were matched using standardized talk titles.
Exploratory Analysis
Selected EDA
Before building the final dashboard, I explored how TED changed over time across content length, topic mix, and presentation style. These early analyses helped shape the larger story behind the project.
Talks Got Shorter
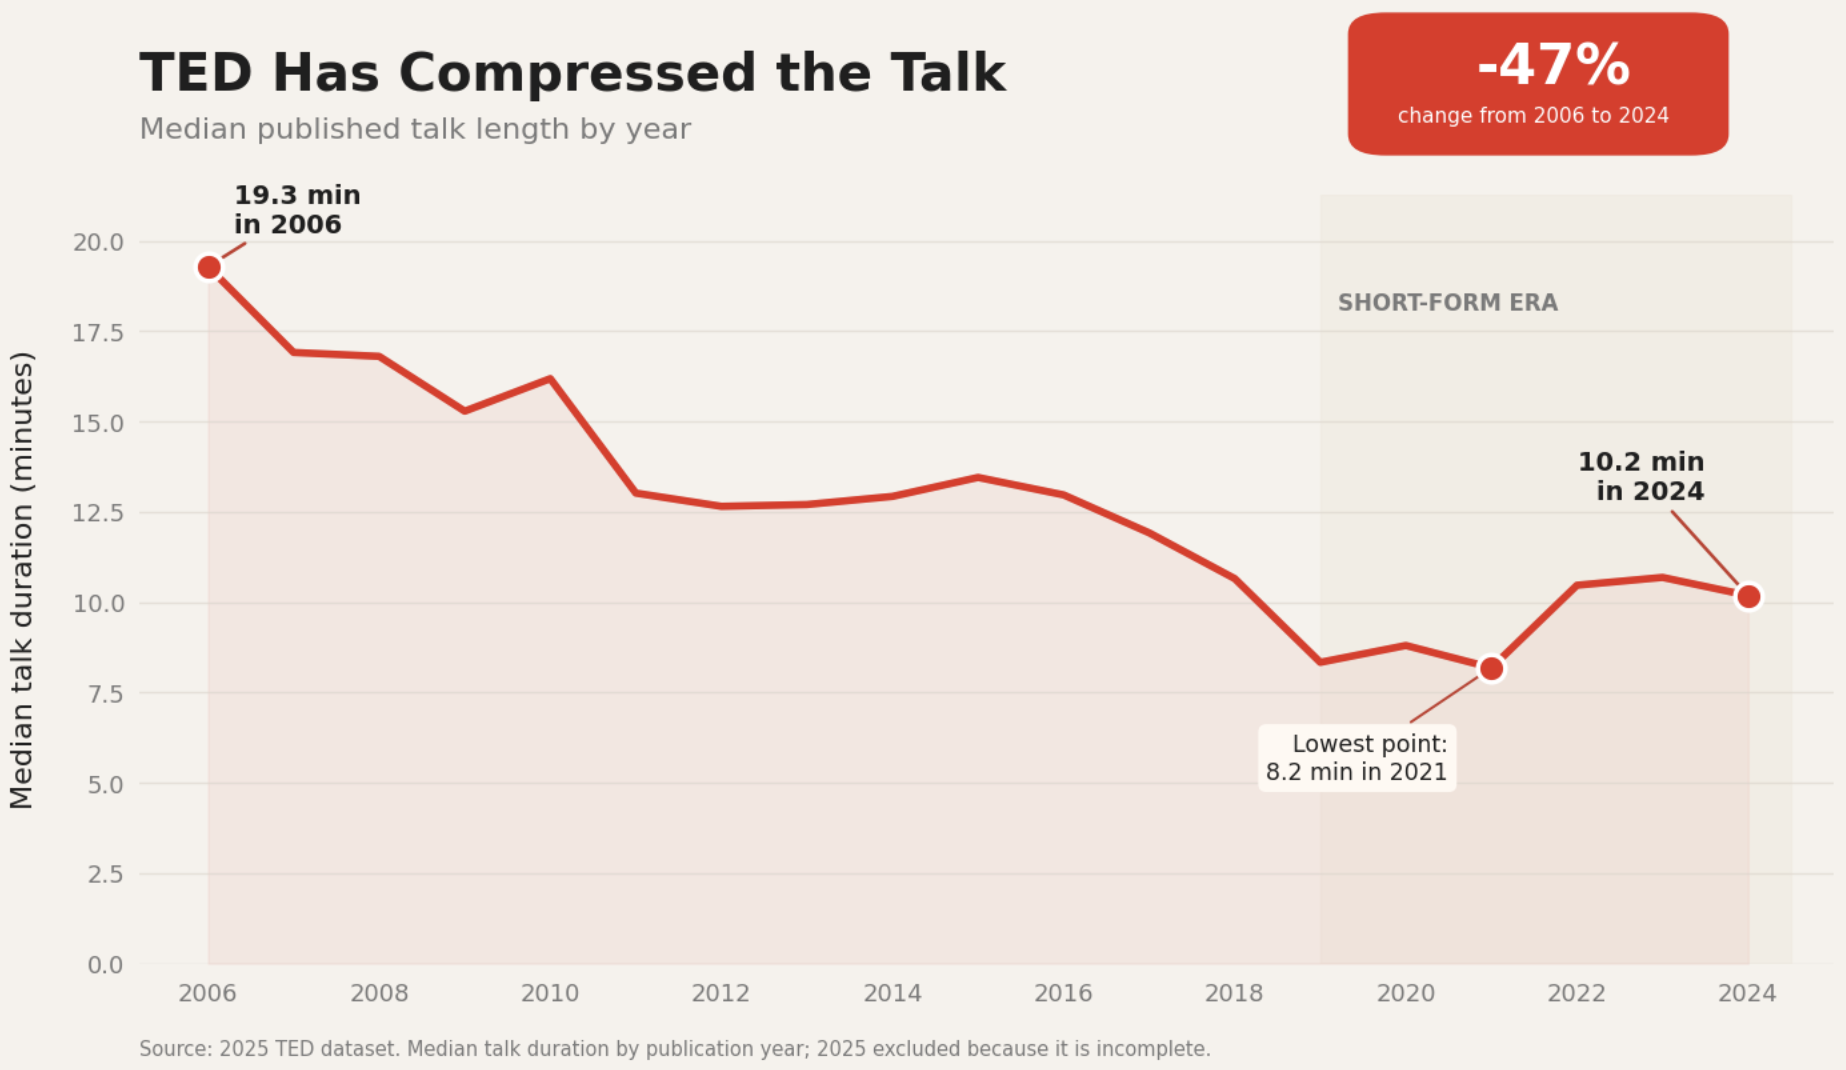
Median talk duration declined over time. This was one of the first signals that TED may have been adapting its content to changing audience habits rather than preserving the traditional conference-talk format.
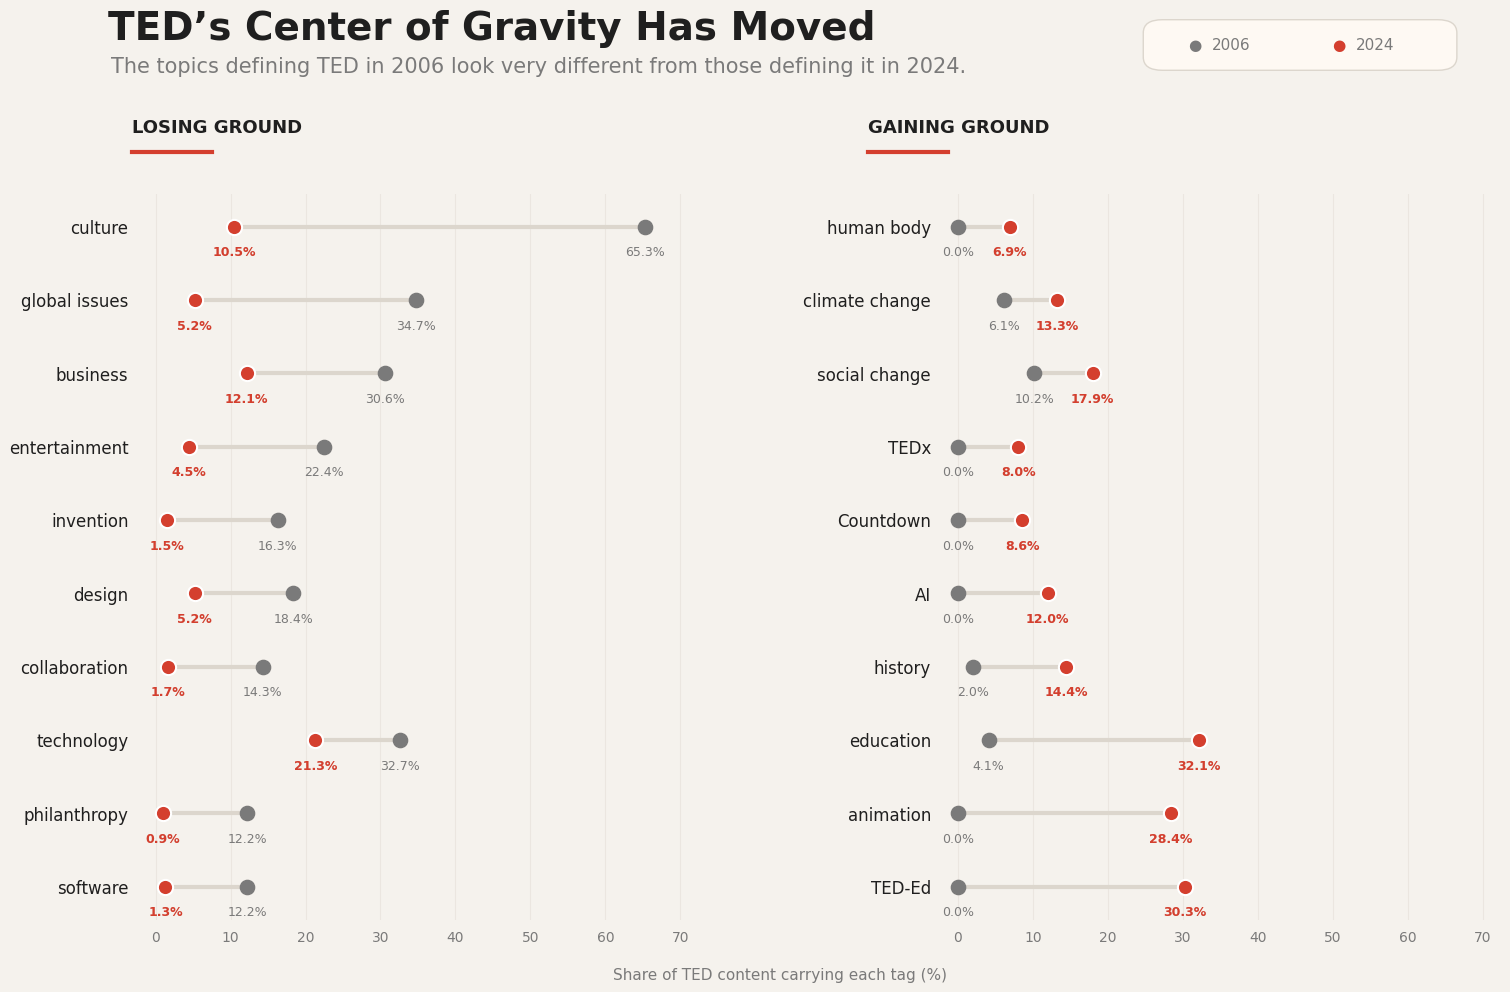
TED’s Topic Mix Shifted
The share of talks devoted to different topics changed substantially over time. This suggested that TED was not just changing how it presented ideas, but also what kinds of ideas it chose to prioritize.
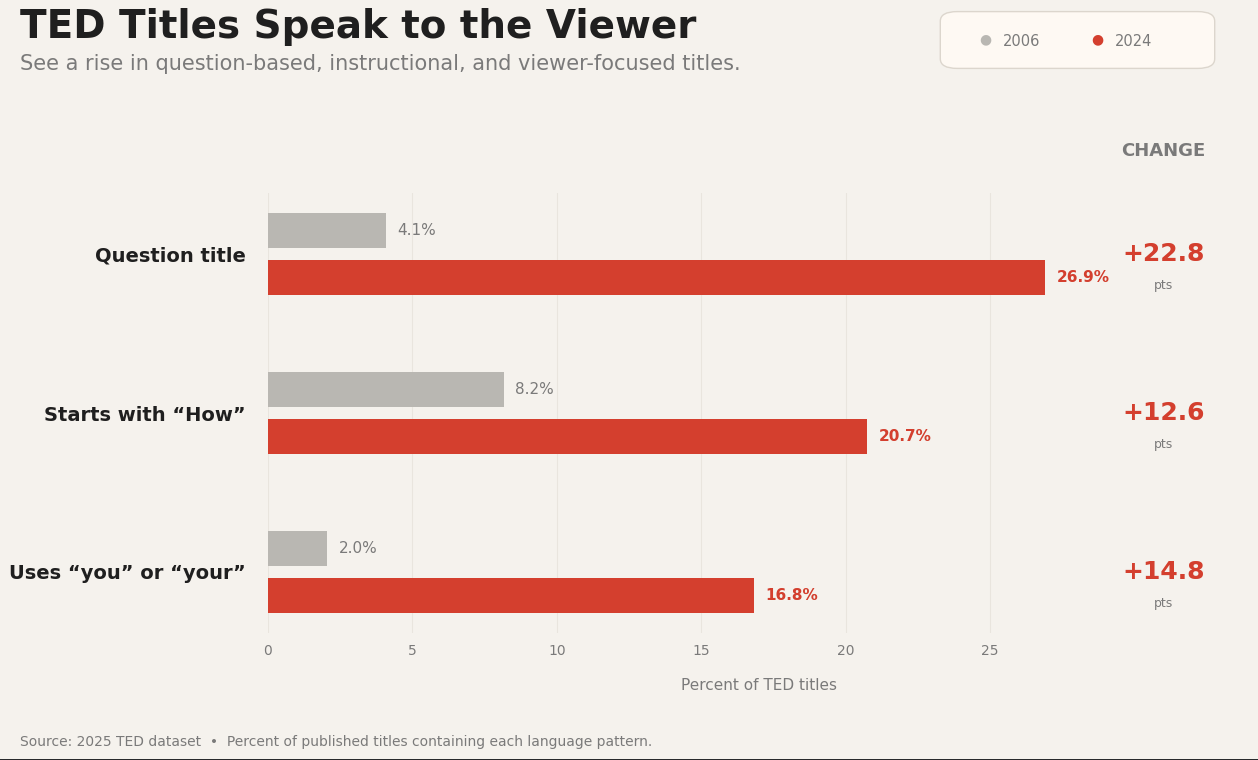
TED Titles Became More Audience-Directed
Question-based titles, “How” titles, and titles using “you” or “your” became more common over time. This suggested that TED’s framing was becoming more directly focused on attracting and speaking to the viewer.
Interactive Dashboard
Use the interactive controls to compare how TED changed across talk length, topic mix, content formats, title framing, and historical audience performance.

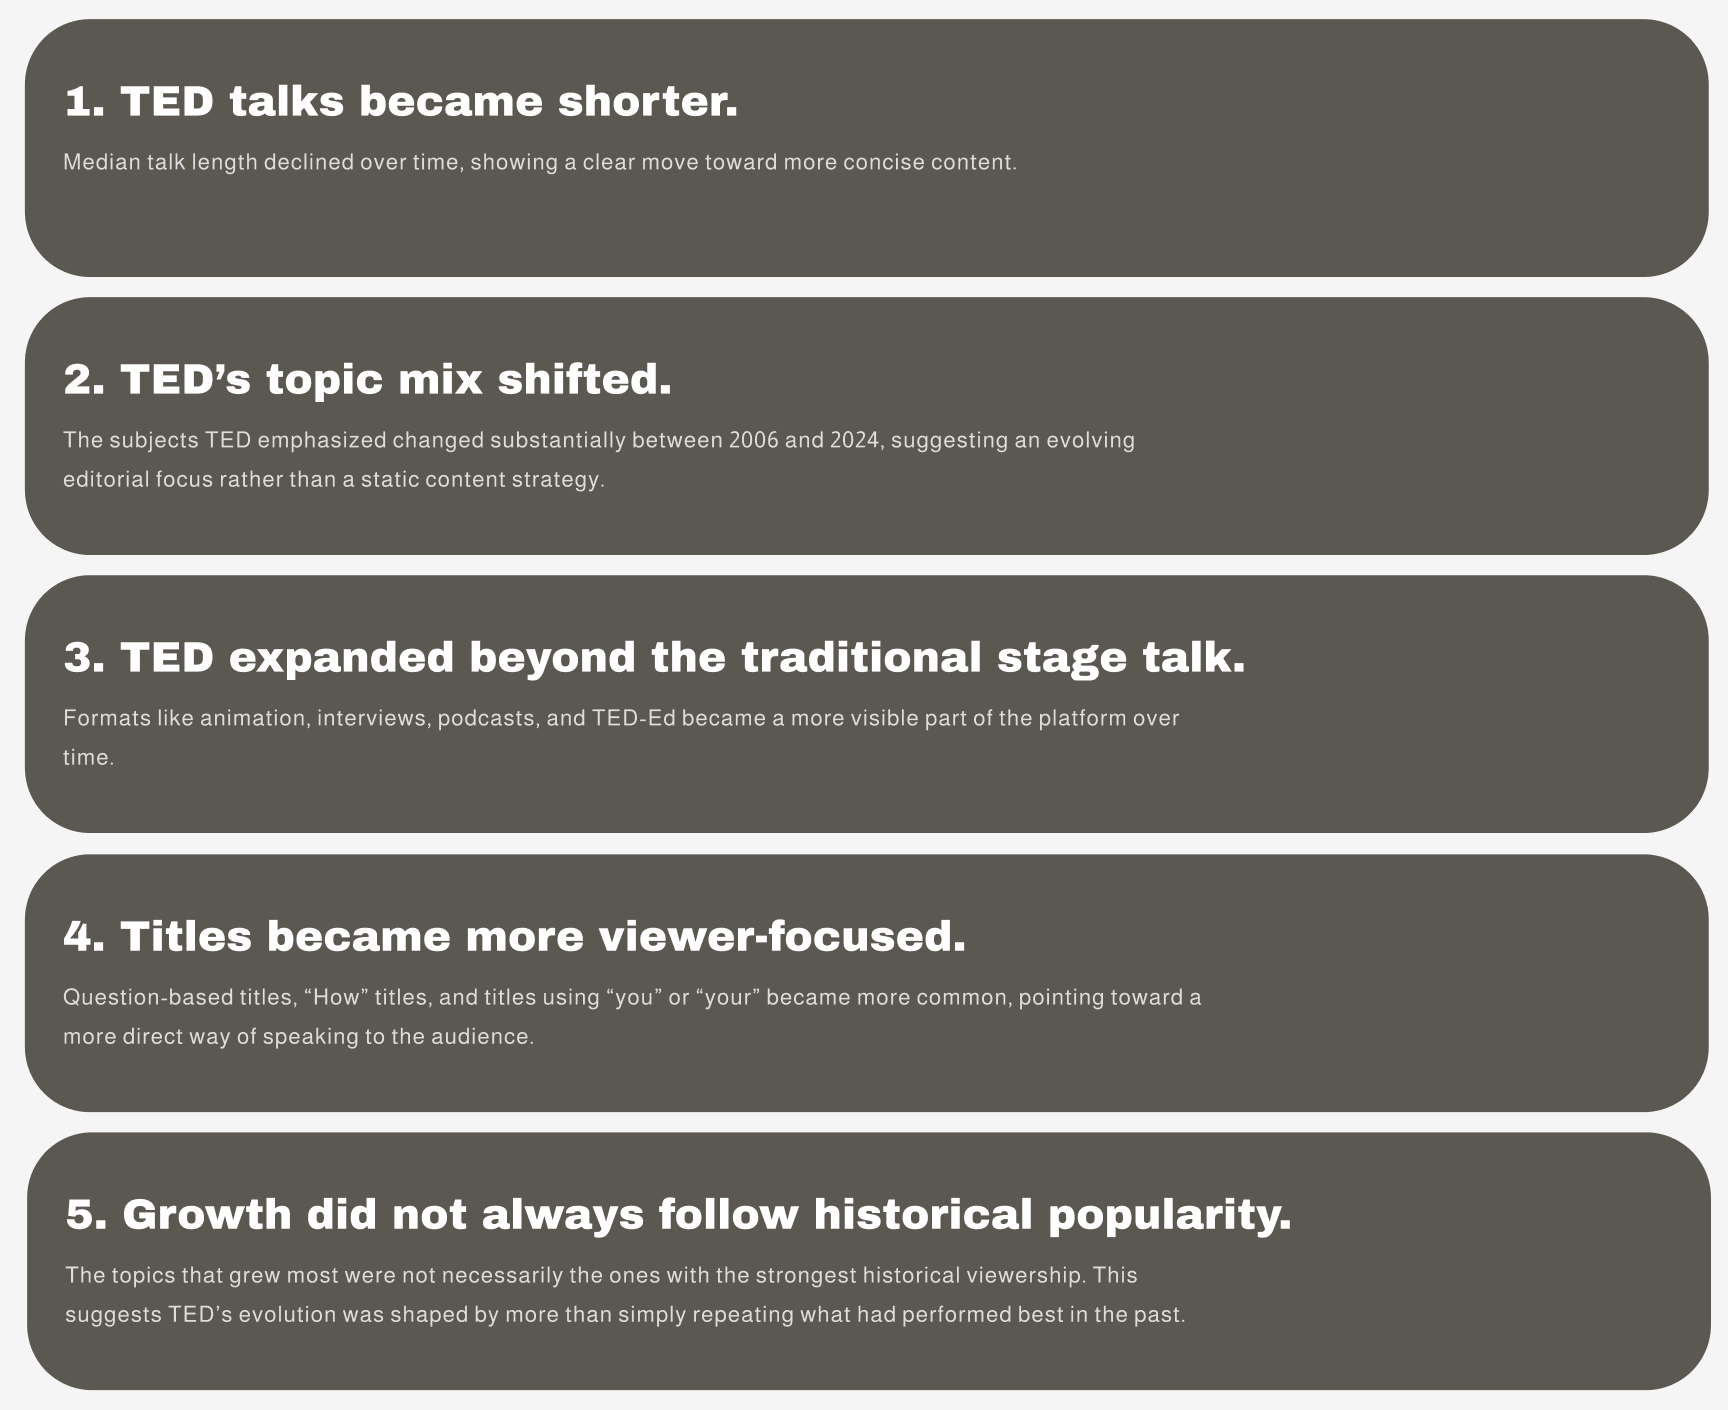
KEY FINDINGS
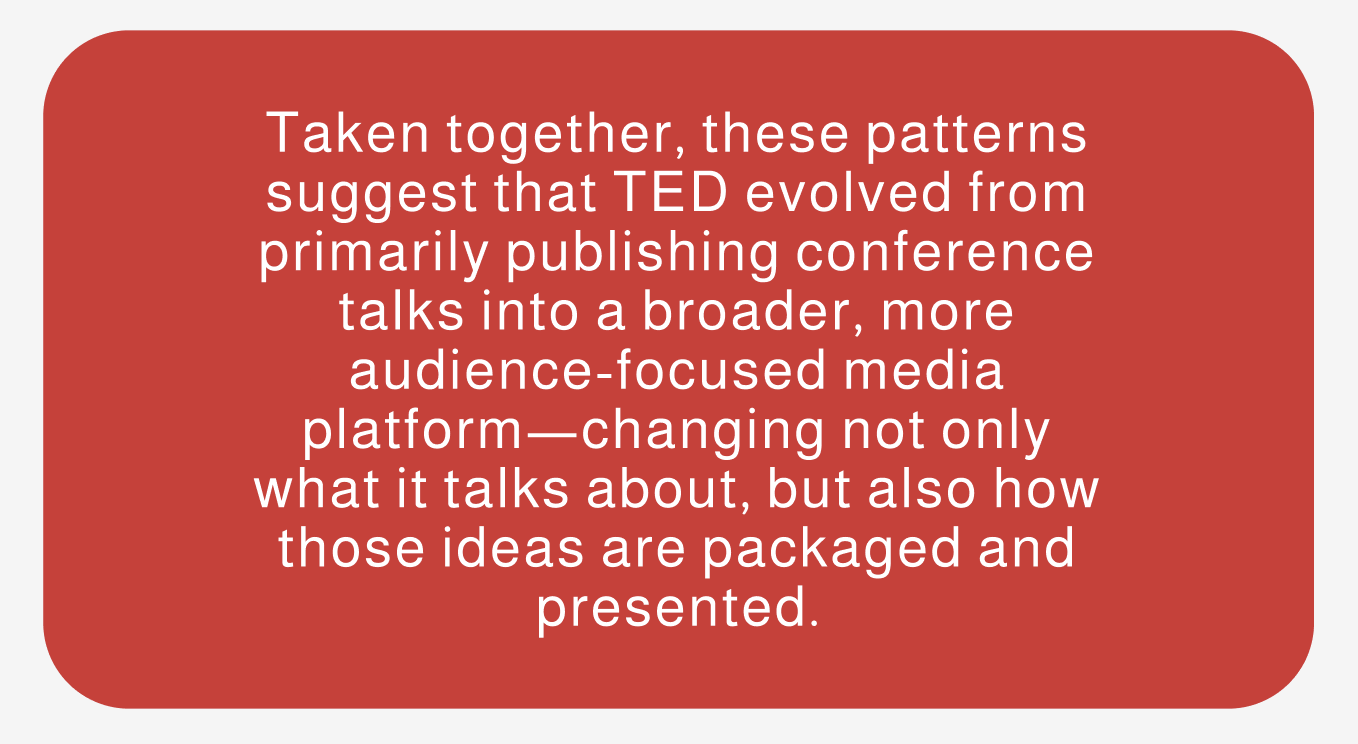
The Bigger Story
Limitations
Historical views are not current.
The view-count dataset only covers talks through roughly 2020, so I used it as a historical benchmark rather than a measure of current popularity.
Not every talk could be matched.
The historical dataset was merged with the newer dataset using standardized talk titles, which means some talks did not have a matching view count.
Tags are imperfect measures of topic emphasis.
Talks can have multiple tags, and TED’s tagging practices may have changed over time.
The analysis shows patterns, not causes.
The data can show how TED changed, but it cannot tell us exactly why TED made those editorial or product decisions.
A/B TEST
Proposed A/B Test
Finding and opportunity
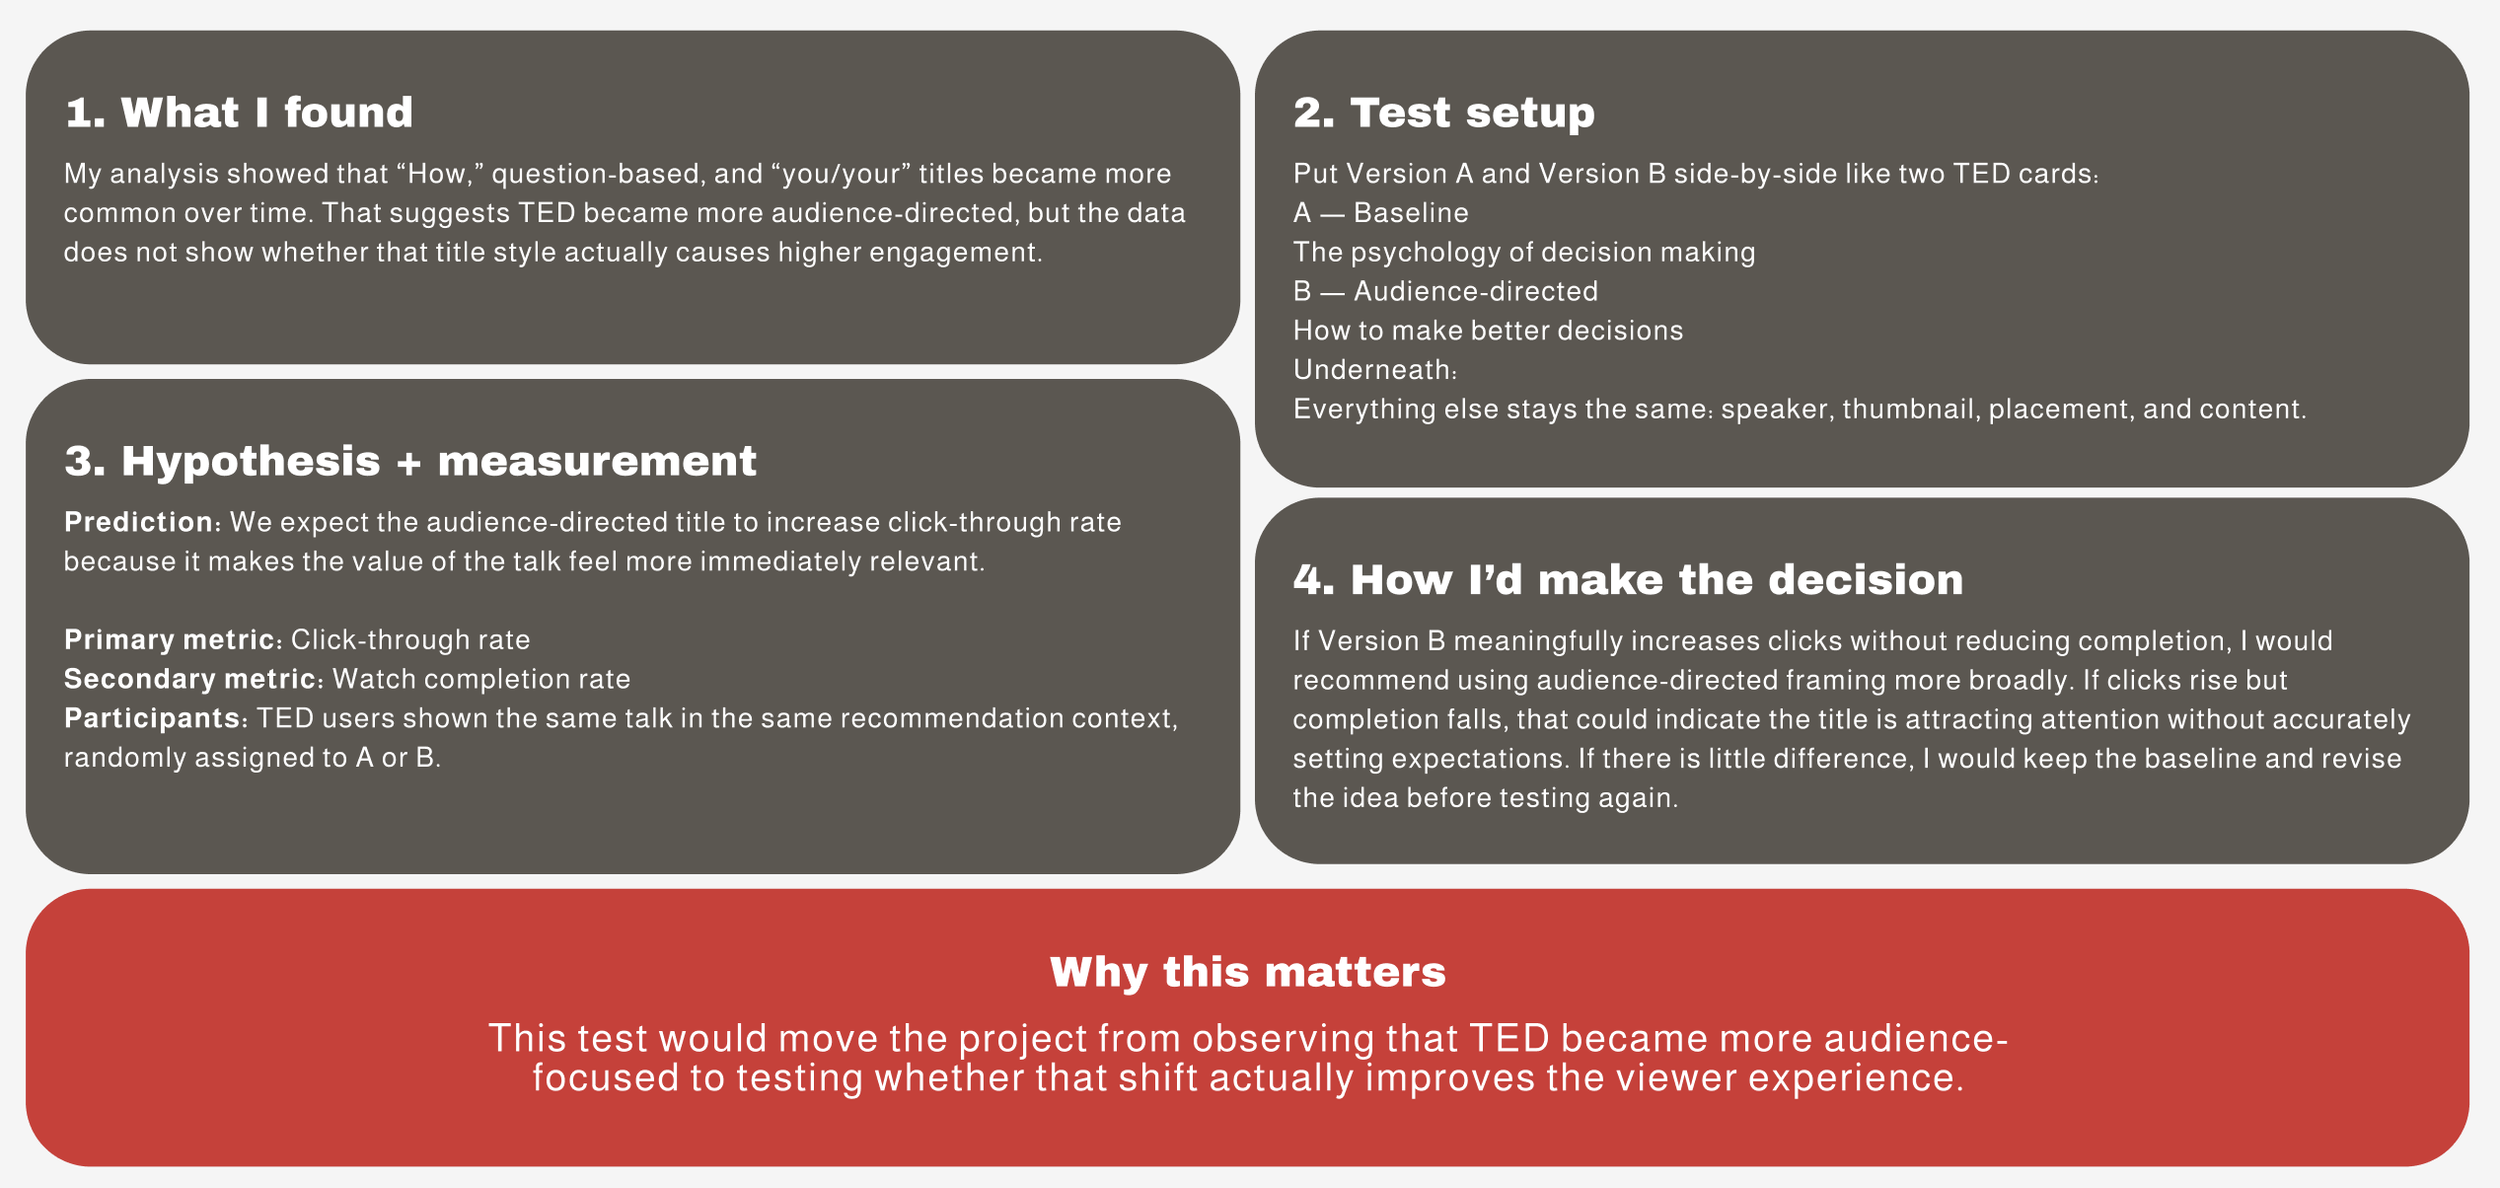
My analysis found that question-based titles, “How” titles, and titles using “you” or “your” became more common over time. This suggests that TED has increasingly framed content in a way that speaks directly to the viewer. However, my existing data only shows that this style became more common; it does not show whether it actually causes higher engagement.
Assumption to test
I would test the assumption that a more audience-directed title makes a TED talk feel more personally relevant and therefore increases the likelihood that someone chooses to watch it.
Future Research
Current audience performance
Use current viewership and engagement data to see whether the patterns in historical views still hold today.
TED vs. TEDx
Compare TED and TEDx separately to see whether their content strategies evolved differently.
Recommendation behavior
Explore whether certain topics, formats, or title styles are more likely to be recommended or surfaced to viewers.
Viewer retention
Look at whether shorter talks or more audience-directed titles actually lead to higher completion rates, not just more clicks.
The next step would be moving from describing how TED changed to understanding which of those changes actually improved the viewer experience.